Cell types and TRAP mouse nomenclature
In some raw data files and analysis code, CP73 refers to Drd1::EGFP-L10a BAC transgenic mice, and CP101 refers to Drd2::EGFP-L10a mice.AIM Scores
Abnormal Involuntary Movements (AIMs) were scored as described in (Cenci, 1998). Four AIMS subtypes were recorded: locomotive dyskinesia (Lo), axial dystonia (Ax), orolingual dyskinesia (Ol), and forelimb dyskinesia (Li). A summary AIM score for each mouse was computed as the sum of all of the the Ax, Ol, and Li scores over time. AIM subscores [data] are highly correlated with each other, and the rankings of mice by AIMs severity are similar whether subscores or the integrated score is used.Microarray Data Preprocessing and Normalization
Affymetrix .CEL files were normalized using the RMA algorithm from the R Bioconductor 'affy' package (Gautier, 2004) to produce log2 expression values for each probeset.Pairwise Comparisons Between Treatments
For each (Dose , Cell Type) group, log2 fold change for each gene was computed as the difference in median or mean expression vs. the matched saline-treated group of mice. Welch's t-test was used to assess statistical significance of expression changes for each treatment group vs. the appropriate control. We also considered accounting for the multiple treatment groups using ANOVA and the Tukey HSD test ('aov' and 'TukeyHSD' procedures in the R stats module (R Core Team, 2012). However, since treatments were not expected to be independent, this procedure was excessively conservative, especially after further adjusting for multiple testing over probesets. Resulting p-values were adjusted using the Benjamini-Hochberg procedure with 'multicomp.multipletests' in python statsmodels (Seabold, 2010) to control FDR over all probesets. Nominal and Benjamini-Hochberg adjusted p-values are also reported for pairwise t-tests between each group and its saline control.
For each treatment group, tables of the top differentially expressed probesets were generated by setting a fold-change threshold of 1.5 and an FDR of of 0.10, based on the Benjamini-Hochberg adjusted Welch's t-test p-values .
AIM regression analysis
To test the hypothesis that differences in gene expression might be correlated to variation in AIM severity, we considered a series of nested linear models relating expression of each probeset, dose group, and AIM score:| model | |
|---|---|
| a | AIM ~ expression + C(Dose) + expression:C(dose) |
| b | AIM ~ expression + C(Dose) |
| c | AIM ~ C(Dose) |
| d | AIM ~ expression |
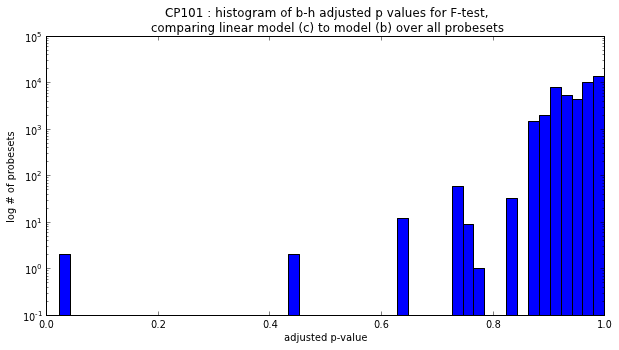
Models were fit using the 'ols' procedure in the python statsmodels module (Seabold, 2010). Since there is obviously dose-dependence of both AIM score and gene expression changes (for those genes that do change), we assessed whether there was a significant relationship between expression and AIM score, given knowledge of the dose group, by comparing model (b) with model (c) using an F-test. After correction for multiple testing, at an FDR of 0.10 there was only one probeset in the CP73 group (1431935_at), and two probesets in CP101 (1453220_at, 1432254_at) for which a linear model including expression was significantly better than predicting from dose group alone. In all three instances, however, the expression measurements overlapped between the dose groups.

A single mouse in the CP101, chronic low dose group, CP101 #1343, had no AIMs observed. This mouse was excluded from the regression analyses and pairwise comparisons between groups, but the genes that were differentially expressed in CP101 #1343 compared to the rest of its group are listed in a table of its expression outliers.
Gene Set and Pathway Enrichment Analyses
The probeset-level expression data were collapsed to Entrez gene symbols by selecting the probeset with the highest median log2 expression value over all samples.Overlap Analysis
Additional References
- Cenci MA, Lee CS, Björklund A. L-DOPA-induced dyskinesia in the rat is associated with striatal overexpression of prodynorphin- and glutamic acid decarboxylase mRNA. Eur J Neurosci, 10(8):2694-706. 1998
- Gautier, L., Cope, L., Bolstad, B. M., and Irizarry, R. A. 2004. affy---analysis of Affymetrix GeneChip data at the probe level. Bioinformatics 20, 3 (Feb. 2004), 307-315
- Kelder T, van Iersel MP, Hanspers K, Kutmon M, Conklin BR, Evelo C, Pico AR. (2011) WikiPathways: building research communities on biological pathways. NAR doi: 10.1093/nar/gkr1074 URL: http://www.wikipathways.org
- Seabold, J.S., Perktold, J. Statsmodels: Econometric and Statistical Modeling with Python. Proceedings of the 9th Python in Science Conference, 2010.
- R Core Team (2012). R: A language and environment for statistical computing. R Foundation for Statistical Computing, Vienna, Austria. ISBN 3-900051-07-0, URL: http://www.R-project.org/.
- McKinney, W. pandas: a Foundational Python Library for Data Analysis and Statistics. PyHPC 2011: Python for High Performance and Scientific Computing.